


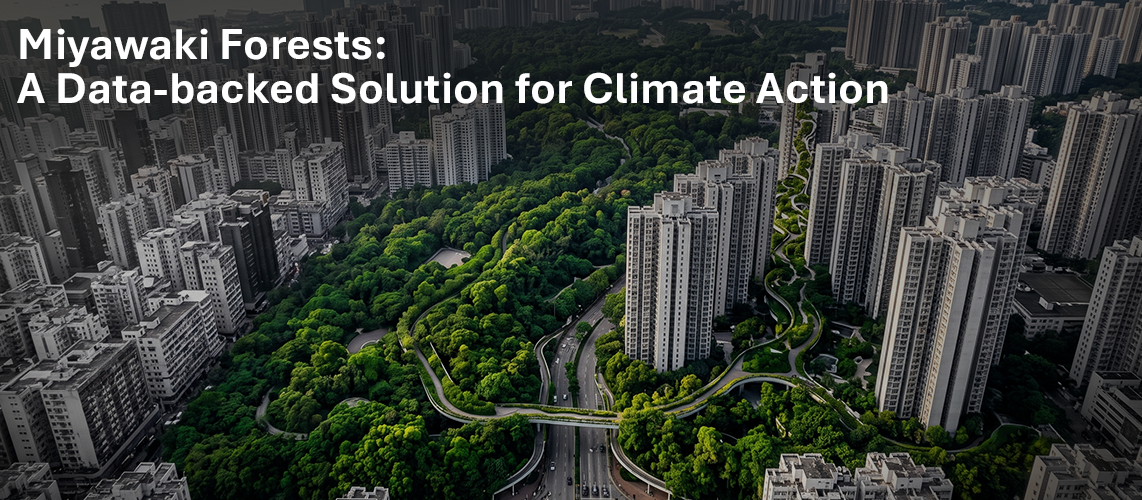
Walk into almost any tech park in Bengaluru, a bustling railway yard in Maharashtra, or a modern apartment complex in Hyderabad, and you will likely stumble upon something remarkable: a pocket-sized jungle.
These micro-forests are created using the Miyawaki method. They are dense, wild, and growing at a pace that feels almost supernatural—like nature running on fast-forward.
Today, everyone is planting Miyawaki forests. Companies plant them for green credentials, cities plant them for cover compliance, and neighborhood groups plant them to beat the scorching urban heat. It feels like a massive win for the planet.
But if you pull aside the organizers and ask one simple question— “Exactly how many kilograms of carbon did this forest soak up this morning?”—the room suddenly goes dead quiet.
The Green Guesswork Problem
Here is an open secret that the sustainability industry rarely says out loud: we have been guessing.
Right now, almost every environmental claim attached to urban tree planting is pulled from generic international spreadsheets, based on European pine forests, or made up by a clever marketing team. Because these Miyawaki forests are packed so tightly together, they grow completely differently than a standard, spaced-out woodland.
This means sustainability teams cannot confidently put these numbers into official reports, and the public is left wondering: Are these micro-forests actually fighting climate change, or are they just high-profile corporate gardening?
The truth is, we don’t need to embellish the numbers. The real science behind these forests is spectacular enough on its own. It just needed an accurate yardstick.
The Math Inside the Jungle
To turn this biological sprint into hard, undeniable data, a landmark field study tracked three young Miyawaki forests in South India. Researchers measured the height and trunk diameter of every single tree to see what was happening beneath the canopy.
What they discovered changes everything we know about urban forestry :
- The 20-Year Shortcut: In just five short years, the Miyawaki forests packed away 165.7 metric tons of carbon per hectare. That is the same amount of carbon storage that a traditional, spaced-out commercial plantation takes 15 to 25 years to build.
The following table summarises the core data points of the article—comparing 5 years of native Miyawaki growth against standard expectations for other managed plantations. It highlights the “compressed time” dynamic mentioned in the article.
| Forest Metric (Per Hectare Baseline) | Native Miyawaki Micro-Forest (5-Year Result)¹ | Conventional Spaced Plantation (5-Year Projection)² | Conventional Spaced Plantation (20-Year Result) |
| Total Stored Carbon (approximate, context-dependent) | ~165 Metric Tons (Mg) | ~35 Metric Tons (Mg) | ~165 Metric Tons (Mg) |
| Time to Maturity Milestone | Rapid Compression (5 Yrs) | Slow (20+ Yrs) | Slow (20+ Yrs) |
| Sequestration Velocity Phase | High-Velocity Compounding (Years 3-5) | Gradual Linear Growth | Gradual Linear Growth |
| Data Reliance | Audit-Ready Field Census Data | Standardised Estimation | Standardized Estimation |
Table 1: The Empirical Anchor
- The Compounding Effect: A forest’s carbon absorption doesn’t grow in a slow, boring, straight line. Between Year 2 and Year 5, the rate at which these trees trapped carbon multiplied by 6.3 times. Once the branches interlock and block out the sky, the forest turns into a compounding carbon-devouring engine.
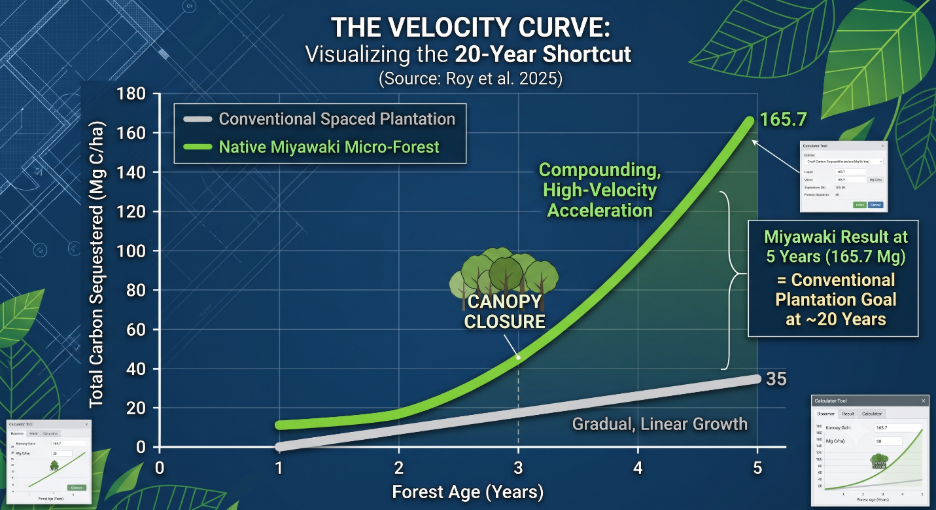
Figure 1: Visualising the Velocity Curve
Note the specific shape in the data—the “hockey stick curve.” This is the best visual metaphor for the compounding nature of carbon storage.
Moving Beyond the “Planting Day” Photo-Op
If we want these micro-forests to be taken seriously as climate shields, how we fund and manage them must change.
Right now, the industry celebrates “Planting Day”—the big corporate event with the shovels and clean shirts. But a sapling that dies six months later stores zero carbon. We need to shift our focus from how many trees we put in the dirt to how much total biomass survives over time. This focus on long-term urban greenery also ties into B.PAC’s work on urban forestry in Bengaluru, including its Urban Forestry Handbook, which discusses the Miyawaki method and its potential for creating concentrated green spaces in the city.
This is exactly why I built the Miyawaki Carbon Calculator. It is a free, field-tested digital tool designed to help sustainability teams plug in real, local measurements and walk away with audit-ready carbon data. No more guessing. No more borrowed European metrics.
Planting a Miyawaki forest is a beautiful, intuitive act. But proving it works requires the cold, clear rigour of science. By replacing vague environmental promises with real numbers, we can ensure our urban pockets of green are doing the heavy lifting our atmosphere desperately needs.
Want to see the interactive calculator in action, look at the specific native tree data, or calculate the true impact of your own green project? Join the conversation and explore the full, science-backed methodology on the original LinkedIn post.